Trading Tools9 min read

TPO Chart Explained: What is Time Price Opportunity and How to Use VAH, VAL & POC in Crypto Trading

What is a TPO (Time Price Opportunity) chart? Learn how Market Profile, ABC letters, VAH, VAL, and POC work, how it updates live, and how to use it for crypto trading.
BTL
Backtest Trading Lab Research DeskQuantitative Backtesting & Market Structure Team • Updated
TPO Chart Explained: What is Time Price Opportunity and How to Use VAH, VAL & POC in Crypto Trading
Executive Summary & Key Takeaways
  • Time at Price vs. Volume: While regular candlesticks show where price traveled, a TPO chart reveals how long price stayed there, uncovering true institutional acceptance vs. temporary rejection.
  • The ABC Letter Brackets: Each 30-minute block prints a letter (A for the first 30m, B for the next, etc.). Long rows indicate fair value consensus; short single prints signify swift rejection.
  • The Big 3 Core Levels: Point of Control (POC = highest time acceptance), Value Area High (VAH), and Value Area Low (VAL = 70% auction core boundaries).
  • Live WebAssembly Updates: Modern TPO terminals stream microsecond ticks client-side, dynamically developing the POC, Initial Balance (IB), and Value Area in real-time.

1. What is a TPO (Time Price Opportunity) Chart?

If you are tired of fake breakouts and confusing wicks on a candlestick chart, it's time to learn the tool institutional traders use: the TPO Chart. Unlike a regular chart that shows you where price went, a TPO chart shows you how much time price spent at each level. This one fundamental change helps you find real support, resistance, and institutional fair value. TPO stands for Time Price Opportunity. It is also widely known as Market Profile. It was originally created by J. Peter Steidlmayer at the Chicago Board of Trade (CBOT) based on Auction Market Theory. The core premise is straightforward: Financial markets function as an ongoing continuous double auction. Buyers and sellers are constantly exploring prices to discover where two-way transaction volume is accepted. A standard candlestick chart treats time as uniform. A 1-hour candle appears visually identical whether the market saw heavy institutional transactions or near-zero liquidity. A TPO chart gives primary importance to price acceptance. When the market spends a significant duration at a specific price, both buyers and sellers have agreed that this level represents fair value. Conversely, rapid moves through a level reveal rejection. Over the course of a trading session, the TPO chart organizes this time distribution into a statistical sideways bell curve, revealing the exact auction core.

TPO vs. Candlestick Chart: What's the Difference?

Candlestick Chart: Answers the question — "What was the price at a specific point in time?" TPO Chart: Answers the question — "How much time did the market spend at a specific price?" For price action, order flow, and volume analysis, TPO is significantly more potent because it filters out retail noise, compresses multi-hour chop, and exposes institutional footprints.

2. Understanding the ABC Letters in a TPO Chart

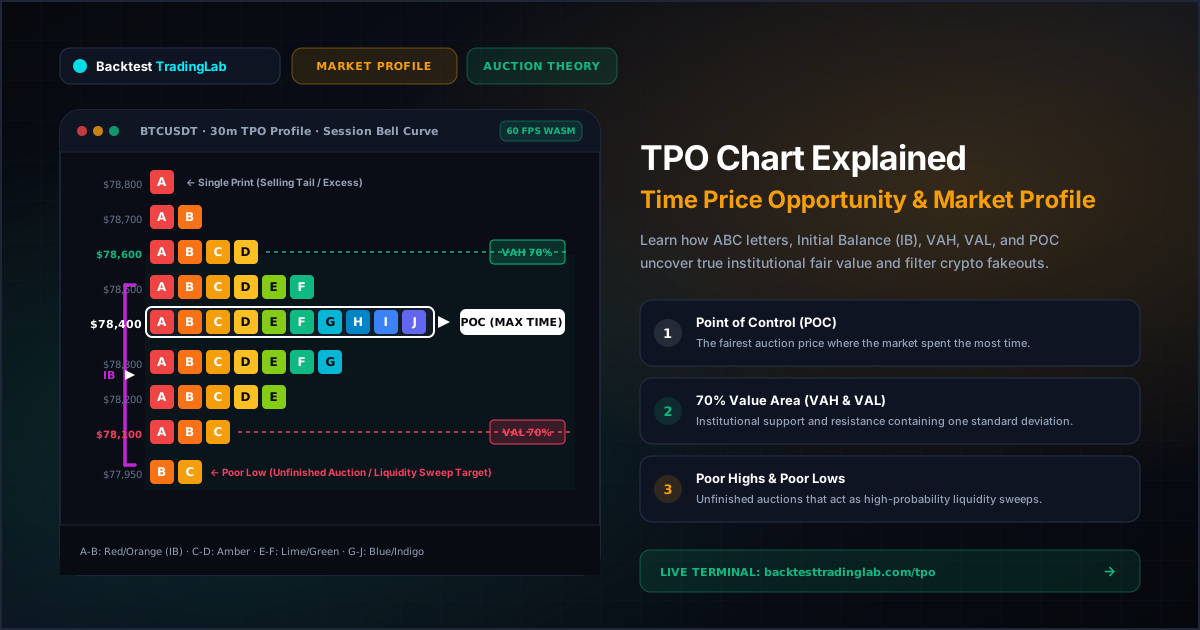
The letter block distribution is often the most confusing element for beginners, but the underlying mechanic is remarkably simple. In a standard TPO chart, a trading session is sliced into 30-minute time blocks (brackets). Each 30-minute period is assigned a sequential letter of the alphabet: • A = First 30 minutes of the trading session • B = Second 30 minutes of the trading session • C = Third 30 minutes of the trading session • ...and continuing chronologically through D, E, F, up to Z. How It Works on the Grid: Whenever price trades at a particular price level during a 30-minute window, that period's letter is printed at that exact price tick. For example, if Bitcoin trades at $78,400 across nine different half-hour periods, you will see a horizontal block showing: A B C D E F G H I. This confirms the market spent four and a half hours rotating around $78,400, establishing profound price acceptance. A long horizontal row of stacked letters signifies high fair-value acceptance. A narrow row with only 1 or 2 single letters signifies swift price rejection (excess).

3. The 3 Most Important Levels: POC, VAH, and VAL

These three benchmark metrics form the quantitative foundation of all Market Profile strategies:

1. POC — Point of Control

The price level with the longest horizontal row of letters. It marks the exact price where the market spent the most time during that trading session. What it means: The POC represents the perceived fairest price of the day. In auction theory, price acts like an elastic band around the POC. When price stretches too far away without new volume, it frequently reverts to retest the POC. Institutional desks routinely use developing and virgin POCs (VPOC) for mean-reversion scalp entries.

2. Value Area — VAH and VAL (The 70% Rule)

A healthy market distribution forms a statistical bell curve. Approximately 70% of all trading activity (corresponding to one standard deviation in normal distribution) occurs within a central zone known as the Value Area. • VAH (Value Area High): The upper boundary of the Value Area. In a balanced market, VAH functions as strong institutional resistance. • VAL (Value Area Low): The lower boundary of the Value Area. In a balanced market, VAL functions as strong institutional support. Core Trading Rules: • Price Inside Value Area [VAL to VAH]: The market is balanced and in consensus. Range-trading strategies (buying VAL, selling VAH) deliver the highest statistical expectancy. • Price Outside Value Area: The market is in imbalance and searching for a new fair value. Trend-continuation and breakout strategies should be prioritized.

3. Poor Highs and Poor Lows — Unfinished Business

In a healthy auction, price reaches an extreme and aggressive responsive traders immediately reject it, leaving a thin tail of single prints (excess). However, when a profile terminates abruptly without a tail—for example, the absolute session low contains two or more letters like B C side by side—this is classified as a Poor Low. A Poor Low or Poor High signals an unfinished auction. Buyers or sellers were halted mechanically rather than through natural exhaustion. These levels represent high-probability magnets for future liquidity sweeps as institutions return to complete the auction.

4. The 4 Classic Market Profile Day Types

TPO allows traders to classify the market environment within the first 1–2 hours of trading: 1. Normal Day: A wide Initial Balance (IB = the range formed during the first hour, periods A and B). Price remains comfortably contained within the IB for the remainder of the session. Ideal for responsive mean-reversion trading between VAH and VAL. 2. Trend Day: An elongated, unidirectional, narrow profile. Aggressive initiative participants drive price continuously in one direction, leaving single prints between successive distribution blocks. Value Area migrates aggressively. Best traded with pure trend-following strategies. 3. Double Distribution: The market establishes an initial balance, followed by an aggressive breakout driven by high institutional volume that migrates price into a secondary zone, forming a second distinct bell curve separated by single prints. 4. Neutral Day: Both buyers and sellers extend the Initial Balance on opposite ends of the range, but neither side achieves directional conviction. Price rotates back and forth, frequently settling near the central POC.

5. How to Use TPO Charts in 24/7 Crypto Trading

Unlike traditional equities or futures markets with defined 9:30 AM to 4:00 PM trading hours, cryptocurrency exchanges operate 24 hours a day, 7 days a week. How Sessions Are Structured in Crypto TPO: On professional institutional terminals like Backtest Trading Lab, crypto profiles are segmented into standard daily UTC sessions (00:00 to 23:59 UTC). This ensures every calendar day has a clear, standardized auction distribution. Advanced traders also analyze the US New York Session (13:00 to 21:00 UTC) because it contains the greatest concentration of institutional spot and derivatives volume.

Practical Crypto Trading Strategies with TPO

1. Filtering Fake Breakouts with Value Area Acceptance: On a standard 5-minute candlestick chart, every minor break above resistance looks like a genuine breakout. On a TPO chart, a legitimate breakout requires price to hold outside VAH/VAL for 2 to 3 consecutive TPO letters (60 to 90 minutes). If price dips back inside the Value Area, a swift rotation to the opposite boundary (VAL) is statistically probable. 2. POC Mean-Reversion Scalps: When Bitcoin or Ethereum extends aggressively beyond VAH leaving thin single prints, lack of time acceptance means buyers are exhausted. If price falters, targeting the daily POC offers an asymmetric 1:3+ Risk-to-Reward mean-reversion scalp. 3. Sweeping Poor Highs and Poor Lows: When a 4-hour or daily session leaves a Poor Low (e.g. at $78,000), institutional algorithms recognize the unfinished business. Placing resting limit orders just below the poor extreme allows traders to capitalize on the impending liquidity sweep.

6. Does TPO Update Live with Price?

Yes, 100% in real-time. On Backtest Trading Lab, all TPO profile mathematics execute directly in your browser using high-performance compiled WebAssembly. As live WebSocket trades stream in from Binance, each active 30-minute bracket dynamically prints new letter blocks at matching price ticks. Crucially, this means the Point of Control (POC), Value Area High (VAH), and Value Area Low (VAL) are developing levels throughout the day. A POC established at $78,400 during the European morning session can migrate down to $78,100 if the New York session spends heavier time at lower levels. These levels only become static once the session officially closes at 23:59 UTC, after which they serve as historical reference levels for the subsequent day.

7. Conclusion: Transforming Your Market Perspective with TPO

If you want to trade with true institutional edge, looking exclusively at candlestick patterns is no longer enough. Candlesticks show what price did; Market Profile reveals the underlying auction intent and whether participants accepted or rejected those prices. How to Start Today: 1. Mark yesterday's Value Area High (VAH), Value Area Low (VAL), and Point of Control (POC) on your chart. 2. Observe how today's price reacts when testing these key levels. 3. Watch for poor highs, poor lows, and Initial Balance extensions. You will quickly discover that levels which appeared completely random on standard candlesticks align with surgical precision to yesterday's TPO distribution. Open the free Backtest Trading Lab TPO Profile Terminal for BTC/USDT, examine today's developing Value Area, and start trading auction market theory with institutional clarity.

Frequently Asked Questions (FAQs)

What is a TPO Chart in trading?
A TPO (Time Price Opportunity) Chart, also known as Market Profile, organizes market data into 30-minute brackets labeled with letters (A-Z). Rather than merely plotting price versus volume, TPO charts show how much time price spent at each level, helping traders identify institutional fair value versus rapid price rejection.
What are VAH and VAL in Market Profile?
VAH (Value Area High) and VAL (Value Area Low) represent the upper and lower boundaries of the Value Area, which encompasses approximately 70% of the session's total trading time (one standard deviation of normal market distribution). In balanced markets, VAL acts as high-probability support while VAH acts as resistance.
What is the POC in TPO?
The Point of Control (POC) is the price level with the longest horizontal row of TPO letter prints. It represents the fairest price of the trading session where buyers and sellers conducted the most two-way auction. It acts as an institutional magnet where price frequently reverts to retest.
How does TPO work in 24/7 Crypto markets like Bitcoin?
Because crypto exchanges trade continuously without traditional market closes, professional platforms like Backtest Trading Lab segment profiles into standard daily UTC sessions (00:00 to 23:59 UTC) or high-volume killzones (such as the New York US Cash Session from 13:00 to 21:00 UTC). This gives each day an independent, mathematically consistent bell-curve auction profile.
Institutional Auction Theory

Ready to Trade with TPO Market Profile? Launch the Live Terminal Free

Stop guessing on standard candlestick wicks. Inspect rotational price acceptance, Initial Balance brackets, and 70% Value Area extremes in real-time across all Binance USDT perpetuals.

Next Guide in Trading Tools Series12 min read

How to Backtest Forex and Gold (XAU/USD): Higher Timeframe PDA to Lower Timeframe CISD Execution with Institutional Risk Math

Learn how to backtest forex and gold strategies bar by bar. Master the transition from 4H Fair Value Gaps (FVG) to 15M Change in State of Delivery (CISD) confirmation, exact pip value calculation, and gold lot sizing.