
Technical Analysis10 min readFact-Checked & Verified
What is Backtesting in Trading? Step-by-Step Crypto Strategy Validation and Risk Sizing
Learn what backtesting is and how to backtest smart money concepts bar by bar. Free browser bar replay simulator with Binance futures position size calculator.
SMA
Quantitative Research DeskCryptocurrency Derivative Strategist & Risk Modeling Specialist • Updated
Executive Summary & Key Takeaways
- Quantitative Foundation: Backtesting is the disciplined simulation of predefined trading strategies on historical candlestick data, establishing empirical proof of edge before risking live capital.
- Crypto Market Realities: In high-volatility cryptocurrency perpetual markets (24/7 liquidity swings, dynamic funding rates), calculating safe liquidation buffers and exact dollar risk prevents forced margin wipeouts.
- Smart Money Concepts (SMC): Backtesting institutional order flow bar by bar requires mapping Higher-Timeframe (4H/1H) demand zones/FVGs, followed by Lower-Timeframe (15M/5M) structural confirmation.
- Two-Way Chart Synchronization: Modern web terminals allow drawing Long/Short position boxes that automatically sync Entry, Stop Loss, and Take Profit into real-time Risk-to-Reward and dollar risk calculations.
- Free Replay Access: Emerging traders can access institutional-grade 1-minute historical bar replay directly in their browser without recurring monthly subscription paywalls.
1. What is Backtesting? The Foundation of Trading Edge
Backtesting is the foundational discipline separating consistent quantitative and price action traders from retail speculation. In volatile cryptocurrency markets—where 24/7 liquidity swings, dynamic funding rates, and high leverage amplify both opportunity and risk—validating trading models on historical market data is essential before risking live capital.
What is Backtesting?
Backtesting is the quantitative process of testing a predefined trading strategy, entry trigger, or risk rule on historical market data. By simulating historical market progression without revealing future price candles, a trader tests execution accuracy, stop-loss invalidation, and take-profit targets under realistic market conditions.
The primary objective of backtesting is not simply confirming whether a trade was profitable, but measuring key statistical metrics across a meaningful sample size:
• Win Rate (%): The percentage of successful trade executions over a defined sequence (e.g., 50 to 100 setups).
• Risk-to-Reward Ratio (R:R): The average dollar or percentage return earned relative to initial capital risked.
• Maximum Drawdown (MDD): The deepest peak-to-trough equity reduction during losing sequences.
• Profit Factor & Trade Expectancy: The mathematical verification that your system maintains a positive edge over time.
$$\text{Mathematical Expectancy } (E) = (P_{\text{win}} \times W) - (P_{\text{loss}} \times L) > 0$$
Where $P_{\text{win}}$ is the probability of winning, $W$ is the average reward in R-multiples, $P_{\text{loss}}$ is the probability of losing, and $L$ is the loss magnitude (typically 1.0R). When your expected return per dollar risked is consistently positive over 100 trials, your trading strategy possesses a genuine statistical edge.
Institutional Desk Rule of Thumb
"Never permit a single trade to risk more than 1.0% to 1.5% of liquid portfolio equity. If your strategy encounters 6 consecutive losses, your capital remains at 94%, leaving you mathematically equipped to fully recover."
2. Why is Backtesting Critical in Crypto Markets?
Cryptocurrency markets differ fundamentally from traditional equities and closed-session forex pairs. Trading digital assets involves around-the-clock liquidity, algorithmic weekend volatility, and leveraged derivative products such as USDT-margined perpetual futures.
1. Elimination of Hindsight Bias:
Looking at a static, finished chart gives an illusion of predictability. Anyone can look at a 4-hour Bitcoin chart and spot where price reversed. However, static analysis completely obscures the emotional and analytical uncertainty present when that candlestick was forming. Stepping through candles bar by bar forces you to make decisions based only on the structural information available at that exact timestamp.
2. Perpetual Margin & Liquidation Buffer:
In cryptocurrency perpetual contracts, market volatility can wipe out accounts that rely on arbitrary leverage multipliers. An unbacked 20x or 30x position entered at market without calculated stop-loss invalidation risks liquidation on a routine liquidity sweep. Backtesting with precise risk sizing allows traders to calculate safe liquidation buffers and margin requirements before entering a position.
3. Psychological Conviction During Adverse Streaks:
Even a premier quantitative strategy with a 60% win rate has an 8.2% mathematical probability of encountering four consecutive losses within any 100-trade sequence. When a trader proves over a 100-trade sample that five consecutive losses fall within normal statistical variance, they eliminate revenge trading and emotional deviations from their trading plan.
Interactive Math Laboratory
Model the formulas from this guide in real timeCash at Risk$100.00
Exact Position Units40.00 Units
3. How to Backtest Smart Money Concepts Bar by Bar in Crypto
Applying institutional price action—such as Order Blocks, Fair Value Gaps (FVG), Liquidity Sweeps, and Market Structure Shifts (MSS)—requires granular execution analysis. Mastering how to backtest smart money concepts bar by bar follows a disciplined three-stage routine:
Stage 1: Higher-Timeframe Structure Mapping (4H / 1H):
• Use the replay cut mode to hide future price progression at an arbitrary historical date.
• Mark out external range liquidity (Previous Day Highs/Lows, Buy-Side and Sell-Side Liquidity pools).
• Identify unmitigated demand zones, Fair Value Gaps (FVG), and institutional Order Blocks where smart money has left footprints of accumulation or distribution.
Stage 2: Lower-Timeframe Confirmation (15M / 5M):
• Step candles forward bar by bar until market price trades directly into your higher-timeframe Point of Interest (POI).
• Do not enter blindly; wait for lower-timeframe confirmation.
• Observe candle bodies for a Change in State of Delivery (CISD) or Break of Structure (BOS) with strong displacement volume.
Stage 3: Order Setup and Execution Math:
• Align the entry level at the retest of the Fair Value Gap or Order Block midpoint.
• Position the stop loss strictly below the structural invalidation low (plus a small spread buffer).
• Target the opposing institutional liquidity pool or premium equilibrium level to secure an asymmetric Risk-to-Reward ratio.
Advertisement
Google AdSense Placement ZoneSlot ID: 7382910482 • Responsive Display Unit (Compliant Placement)
4. Real-World Execution: The Crypto Bar Replay Terminal
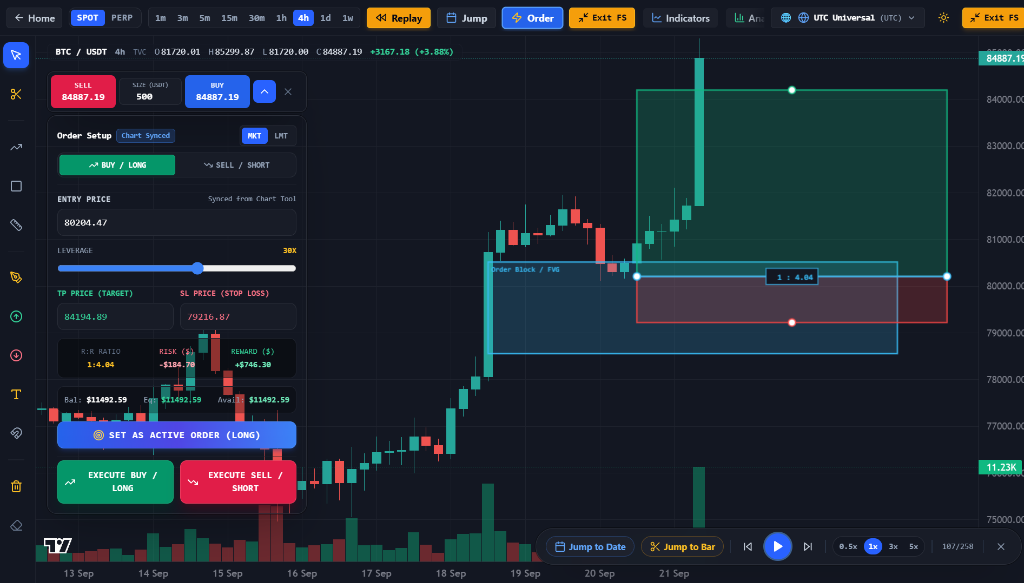
To illustrate institutional setup validation, examine the live replay execution below on a 4-Hour BTC/USDT market structure:
In the terminal setup displayed in Figure 1:
1. Identifying the Setup: The trader spots an institutional Order Block and bullish Fair Value Gap on the 4-Hour BTC/USDT chart following a liquidity sweep.
2. Drawing the Position Tool: Using the chart toolbar, the trader draws an interactive Long Position tool spanning from entry at $80,204.47 down to structural invalidation at $79,216.87, targeting opposing liquidity at $84,194.89.
3. Automatic Bidirectional Synchronization: The terminal's order panel immediately reads the exact coordinates from the chart tool. Notice how the Entry ($80,204.47), Target TP ($84,194.89), and Stop Loss ($79,216.87) populate instantly without manual typing.
4. Capital & Leverage Modeling: Setting an allocated margin size of $500 USDT at 30x leverage yields an exact notional position of $15,000 USDT. The mathematical risk engine computes:
- Cash Risk at Invalidation: -$184.70 (36.9% of margin)
- Cash Reward at Target: +$746.30 (149.3% of margin)
- Exact Risk-to-Reward Ratio: 1:4.04
5. Binding Active Orders: Clicking "SET AS ACTIVE ORDER (LONG)" binds the order coordinates directly into the historical replay engine. As the trader advances subsequent candles bar by bar, the terminal automatically simulates fills, stop runs, and take-profit hits under authentic Binance exchange precision.
5. Overcoming Paywalls: A Free TradingView Replay Alternative Without Subscription
Historically, reliable multi-timeframe bar replay functionality has been locked behind expensive monthly charting subscriptions ($14.95 to $59.95/month). For emerging quants and independent price action traders, high recurring software overhead adds unnecessary drag to capital accumulation before their trading models even achieve profitability.
Using a modern browser-based client, traders now have access to a free TradingView replay alternative without subscription. By running multi-year 1-minute historical OHLC candle data locally via HTML5 and high-performance canvas engines, traders enjoy institutional-grade backtesting features without financial barriers:
• Multi-Year 1-Minute Historical Candle Depth: Seamlessly jump back years into crypto bull and bear market cycles (2020–2026).
• Multi-Timeframe Switching: Seamlessly toggle between 1m, 3m, 5m, 15m, 30m, 1h, 4h, 1d, and 1w candles while preserving your active replay cutoff.
• Client-Side Execution Speed: Candle stepping occurs instantly in your browser memory without server ping delays or bandwidth throttling.
• 100% Local Privacy: Your proprietary trading setups, Fibonacci levels, and journaled trades remain stored strictly in local browser storage, never transmitted to external databases.
6. Sizing Leverage with a Dedicated Crypto Position Size Calculator Binance Futures
One of the most destructive pitfalls in retail cryptocurrency trading is confusing leverage with position risk. Setting 20x, 30x, or 50x leverage does not dictate how much money you lose; your stop-loss distance multiplied by total contract quantity determines your true capital risk.
Consider two traders with identical $10,000 accounts buying Bitcoin at $80,000 with an invalidation stop at $78,400 (a 2.0% stop distance):
• Trader A uses 10x leverage on their entire account ($100,000 notional = 1.25 BTC). If stopped out, they lose $2,000 (20% of their total net worth).
• Trader B uses our dedicated crypto position size calculator binance futures. They specify an exact 1% risk rule ($100 risk). With a 2.0% stop distance, the calculator dictates buying exactly 0.0625 BTC ($5,000 notional). Whether Trader B selects 5x, 10x, or 25x leverage, their loss upon invalidation is mathematically capped at exactly $100.
Using our unified crypto position size calculator binance futures, traders can instantly determine:
1. True Dollar Risk ($): Pegging initial capital risk to an exact dollar amount or percentage of account equity.
2. Exact Contract Quantity: Calculating the precise quantity of BTC, ETH, or SOL perpetual contracts to execute.
3. Maintenance Margin & Liquidation Buffer: Ensuring that exchange maintenance margin thresholds remain far below your stop-loss price, eliminating liquidation danger.
7. Step-by-Step Practical Workflow to Validate Your Next Strategy
Follow this structured, repeatable protocol whenever testing a new technical concept or price action model:
Step 1: Define Your Edge in Writing
Draft clear, binary rules before opening a chart. For example: "Enter Long only when a 4H Fair Value Gap overlaps with a 15M Market Structure Shift, risking no more than 1.0% of portfolio equity with a minimum 1:2.5 Risk-to-Reward ratio."
Step 2: Replay Past Market Cycles
Open the Crypto Bar Replay Terminal, select your trading pair (e.g., BTC/USDT, ETH/USDT, or SOL/USDT), and use the Scissors Cut tool to jump to a randomized historical market phase (bull run, consolidation, or deep correction).
Step 3: Position Size & Leverage Verification
Place your Long or Short Position tool on the chart. Verify that the synchronized order drawer calculates a viable Risk-to-Reward ratio and that dollar risk matches your portfolio risk limits.
Step 4: Execute & Log 50 to 100 Trades
Advance candles bar by bar, executing trades objectively. Record your performance in the integrated trade journal to confirm whether your win rate, profit factor, and maximum drawdown deliver a verifiable mathematical edge.
8. Summary: From Speculation to Quantifiable Conviction
Backtesting transforms subjective chart reading into an objective, data-backed discipline. By combining multi-year 1-minute historical candle replay with exact perpetual position sizing math, traders gain the empirical confidence required to execute in live cryptocurrency markets without emotional interference.
Stop risking hard-earned capital on untested theories. Launch our free Crypto Bar Replay Terminal today, validate your Smart Money strategy bar by bar, and build the quantitative discipline required for lasting profitability.
Dedicated Quantitative Utility
Crypto Bar Replay Terminal
Execute the mathematical models detailed in this guide inside our standalone interactive calculator.
Next Guide in Technical Analysis Series9 min read
The Core Philosophy of Backtesting: Why Forward Success Demands Historical Proof
Explore why historical replay is the bedrock of quantitative trading edge. Discover how deterministic simulation strips emotion and builds mathematical conviction before risking real capital.