
Technical Analysis12 min readFact-Checked & Verified
How to Backtest Forex and Gold (XAU/USD): Higher Timeframe PDA to Lower Timeframe CISD Execution with Institutional Risk Math
Learn how to backtest forex and gold strategies bar by bar. Master the transition from 4H Fair Value Gaps (FVG) to 15M Change in State of Delivery (CISD) confirmation, exact pip value calculation, and gold lot sizing.
SMA
Quantitative Research DeskInstitutional FX & Commodity Derivatives Specialist • Updated

Executive Summary & Key Takeaways
- Volatile Asset Reality: Gold (XAU/USD) exhibits extreme intraday liquidity sweeps and 500-1000 pip expansions; backtesting historical cycles bar by bar is essential to prevent margin liquidations and emotional stop-outs.
- Contract Size Mechanics: Unlike standard Forex currencies ($100,000 base currency), 1 Standard Lot of Gold equals 100 Troy Ounces ($10 per pip; a $1.00 move equals $100.00 on 1.00 lot, or $10.00 on 0.10 mini lot).
- Top-Down Smart Money Concepts (SMC): High-probability setups originate by identifying Higher-Timeframe (4H/Daily) Premium/Discount Arrays (PDA) such as Bearish Fair Value Gaps (FVG) and Order Blocks.
- Lower-Timeframe Execution Trigger: Once the 4H POI is tapped, shifting down to the 15-Minute chart to confirm a Change in State of Delivery (CISD) below intermediate swing lows secures an asymmetric Risk-to-Reward ratio (e.g. 1 : 5.06).
- Free Multi-Timeframe Bar Replay: Backtest Trading Lab provides 1-minute historical candle depth and seamless timeframe toggling across Gold and 14 Forex pairs with zero monthly subscription paywalls.
1. Why Backtesting in Forex & Gold (XAU/USD) is Mission-Critical
Gold (XAU/USD) is widely recognized as one of the most liquid and volatile instruments in global financial markets. Driven by macroeconomic interest rate shifts, geopolitical hedging, and central bank physical accumulations, Gold frequently delivers intraday price expansions spanning $30 to $80 (equivalent to 300 to 800 standard pips).
For retail traders attempting to trade Gold without disciplined validation, this volatility is double-edged. When London and New York sessions overlap, or during major high-impact macroeconomic releases (US Non-Farm Payrolls, CPI inflation reports, and FOMC interest rate decisions), algorithmic high-frequency trading desks execute massive liquidity sweeps designed to engineer counter-trend slippage and wipe out predictable retail stops.
Why Static Charting Fails (The Hindsight Bias Trap):
Looking at a static, completed chart creates an illusion of certainty. Anyone can inspect historical price action after the fact, spot an obvious reversal pivot, and assert they would have sold the absolute high. However, static analysis completely ignores the real-time uncertainty, wide bid-ask spread expansions, and psychological pressure present when candles are actively printing.
Bar-by-bar backtesting forces you to:
• Hide future price action entirely using historical cut modes.
• Identify institutional liquidity pools without knowing if price will respect or violate them.
• Execute orders under authentic market conditions and measure mathematical expectancy:
$$\text{Mathematical Expectancy } (E) = (P_{\text{win}} \times W) - (P_{\text{loss}} \times L) > 0$$
Where $P_{\text{win}}$ is your win rate percentage, $W$ is the average reward in R-multiples, $P_{\text{loss}}$ is your loss frequency, and $L$ is your predefined risk per trade (strictly 1.0R). When verified over 50 to 100 simulated setups, you trade live markets backed by empirical mathematical proof rather than hope.
Institutional Desk Rule of Thumb
"Never permit a single trade to risk more than 1.0% to 1.5% of liquid portfolio equity. If your strategy encounters 6 consecutive losses, your capital remains at 94%, leaving you mathematically equipped to fully recover."
2. Gold Market Mechanics: 100 oz Contracts, Pip Math, and Lot Sizing
A primary reason retail forex traders blow trading accounts on Gold is confusing standard currency lot sizing with commodity CFD specifications. In standard currency pairs such as EUR/USD or GBP/USD, 1 standard lot represents 100,000 units of the base currency, and one pip corresponds to a 0.0001 price increment ($10.00 per pip).
Gold (XAU/USD), however, is traded in Troy Ounces:
• 1.00 Standard Lot = 100 Troy Ounces of Fine Gold ($10.00 per pip / $100.00 per $1.00 move).
• 0.10 Mini Lot = 10 Troy Ounces of Fine Gold ($1.00 per pip / $10.00 per $1.00 move).
• 0.05 Half-Mini Lot = 5 Troy Ounces of Fine Gold ($0.50 per pip / $5.00 per $1.00 move).
• 0.01 Micro Lot = 1 Troy Ounce of Fine Gold ($0.10 per pip / $1.00 per $1.00 move).
Understanding the Gold Pip Definition:
In modern institutional broker feeds, Gold is quoted to 2 or 3 decimals (e.g., $4360.189).
• A $0.10 price movement (e.g. from $4360.00 to $4360.10) equals 1.0 Standard Pip (10 points).
• A $1.00 price movement (e.g. from $4360.00 to $4361.00) equals 10.0 Standard Pips (100 points).
• A $10.00 price expansion (e.g. from $4360.00 to $4370.00) equals 100.0 Standard Pips (1,000 points).
Institutional Gold Dollar Risk Formula:
$$\text{Dollar Risk } (\$) = \text{Lot Size} \times 100 \times |\text{Entry Price} - \text{Stop Loss}|$$
Example: If you execute a SHORT order on Gold with a 0.10 mini lot at an Entry of $4360.189 and a Stop Loss of $4371.501:
• Stop Loss Distance = $4371.501 - $4360.189 = $11.312 (113.1 pips).
• Cash Risk = 0.10 Lots × 100 oz × $11.312 = -$113.12.
If your Target Take Profit is $4302.963:
• Target Distance = $4360.189 - $4302.963 = $57.226 (572.3 pips).
• Cash Reward = 0.10 Lots × 100 oz × $57.226 = +$572.26.
• Realized Risk-to-Reward Ratio:
$$\text{R:R Ratio} = \frac{57.226}{11.312} = 5.06 \quad (1 : 5.06)$$
By backtesting with exact contract math, you ensure your capital risk is mathematically capped regardless of market turbulence.
Interactive Math Laboratory
Model the formulas from this guide in real timeCash at Risk$100.00
Exact Position Units40.00 Units
3. The Institutional Multi-Timeframe Framework: HTF Context to LTF Trigger
Smart Money Concepts (SMC) and Inner Circle Trader (ICT) principles dictate that profitable trading is inherently multi-timeframe. Institutional algorithms do not operate on single isolated charts; instead, higher timeframes dictate macro order flow and liquidity objectives, while lower timeframes provide surgical execution invalidation.
The Core Multi-Timeframe Sequence:
1. Higher Timeframe (HTF - Daily / 4H): Macro Narrative & PDA Delivery
• Identify whether the market is operating in Premium (expensive) or Discount (cheap) relative to the major dealing range.
• Locate institutional imbalance zones: Fair Value Gaps (FVG), Bearish/Bullish Order Blocks, and Liquidity Pools (Previous Day Highs/Lows).
• Wait patiently for price to retrace and tap into your HTF Point of Interest (POI).
2. Lower Timeframe (LTF - 15M / 5M): Micro Confirmation & Structural Shift
• Never enter blindly with limit orders directly at the touch of a 4H level. In strong momentum conditions, price can easily slice through an unconfirmed zone.
• Shift down to the 15-Minute or 5-Minute timeframe to observe internal structure.
• Look for a liquidity purge of local highs/lows followed by an aggressive displacement candle.
• Confirm the Change in State of Delivery (CISD) or Market Structure Shift (MSS).
3. Execution & Management:
• Place an entry on the retest of the lower-timeframe Fair Value Gap or mitigation block.
• Place the stop loss strictly above the invalidation swing high (with a small spread buffer).
• Target the opposing higher-timeframe external liquidity pool.
Advertisement
Google AdSense Placement ZoneSlot ID: 7382910482 • Responsive Display Unit (Compliant Placement)
4. Step 1: Mapping the Higher Timeframe PDA (4H Bearish FVG & Order Block)
To demonstrate this institutional execution model in practice, let us walk through an authentic high-probability setup replayed inside the Backtest Trading Lab Forex Replay Terminal on XAU/USD (Gold).
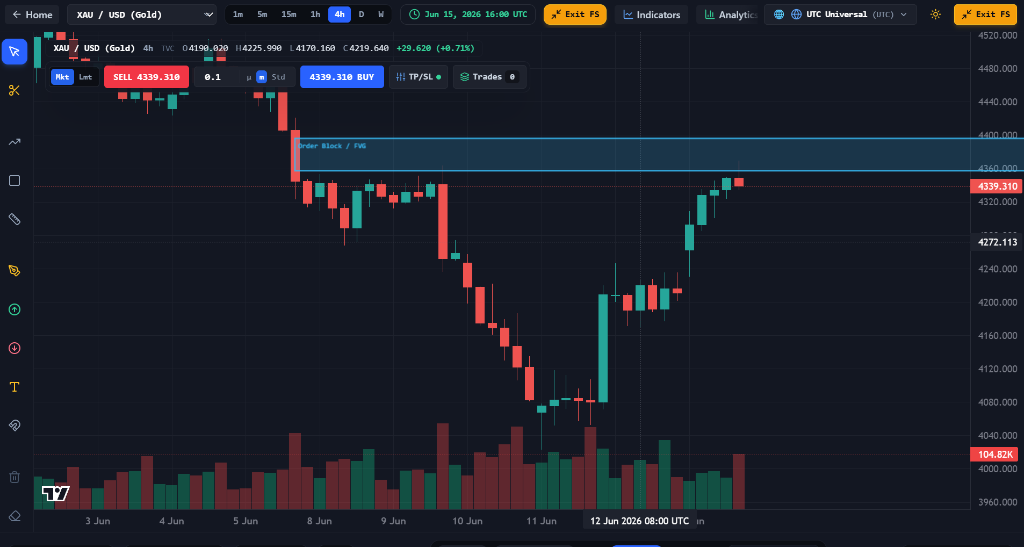
Examine Figure 1 below:
1. Structural Context: Following a severe downward impulse that drove Gold prices down from above $4480 into a deep cyclical low near $4080, smart money distribution left a massive imbalance on the 4-Hour chart.
2. Marking the HTF PDA: Using the rectangular drawing tool, the trader identifies the unmitigated 4-Hour Bearish Fair Value Gap (FVG) and Order Block zone spanning from $4360.00 up toward $4400.00. Notice the clear label [Order Block / FVG] marked on the chart.
3. The Counter-Trend Retracement: Between June 11 and June 15, Gold staged an aggressive 280-pip recovery rally. Uninformed retail traders often perceive such steep green candles as a permanent bullish breakout and enter aggressive long positions at the top.
4. Tapping the Institutional PDA: As the 4-Hour candle reaches $4360.00, it trades directly into the lower boundary of our marked Bearish FVG zone. At this exact moment, the macro condition is fulfilled: Price is trading inside an institutional Premium PDA. Rather than guessing the top, the disciplined trader pauses the replay and shifts to the lower timeframe for structural validation.
5. Step 2: Timeframe Shifting to 15M & Confirming the Change in State of Delivery (CISD)
Once the 4-Hour candle touches the institutional POI, the trader switches the terminal timeframe selector to the 15-Minute (15m) resolution. Inside Backtest Trading Lab, the simulator automatically aligns the exact active bar timestamp (June 16) without losing chart position or drawing coordinates.
What is a Change in State of Delivery (CISD)?
In Smart Money trading, a Change in State of Delivery (CISD) represents the precise algorithmic transition where smart money ceases accumulation and initiates distribution (or vice versa). It is confirmed when:
1. Liquidity Run: Price pushes above the previous 15-minute swing high inside the 4H FVG zone, trapping late breakout buyers and absorbing buy-stop liquidity.
2. Aggressive Displacement: Price reverses with strong momentum, printing large-bodied bearish candles accompanied by rising volume.
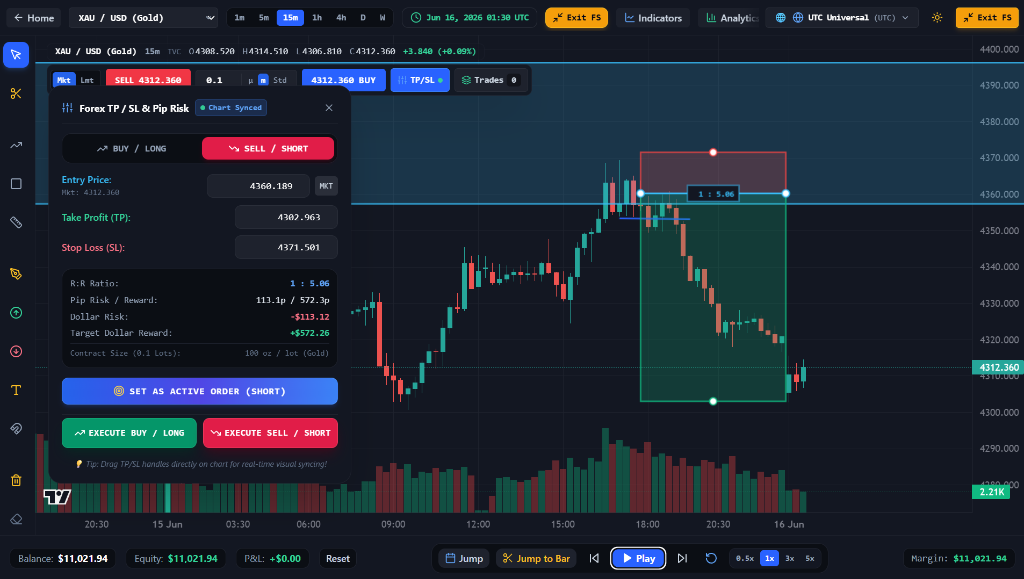
3. Decisive Structural Close: Price closes firmly below the most recent higher-low swing structure (marked with the blue horizontal line at $4355.00 in Figure 2).
This displacement proves that smart money algorithms are now actively delivering price downward. The previous uptrend is officially invalidated.
6. Step 3: Precision Order Execution, Risk Sizing, and 1:5.06 R:R Math
With the 15-Minute CISD confirmed, the trader positions the interactive Short Position tool directly on the retest of the broken level at $4360.189.
Examine Figure 2 below and note how the terminal executes authentic institutional risk modeling:
1. Two-Way Bidirectional Chart Sync:
As soon as the Short Position tool is placed on the chart, the "Forex TP / SL & Pip Risk" popover instantly synchronizes:
• Entry Price: Populates automatically as $4360.189.
• Stop Loss (SL): Locked strictly above the local rejection wick at $4371.501 (a distance of 113.1 pips).
• Take Profit (TP): Anchored at the major opposing sell-side liquidity pool at $4302.963 (a distance of 572.3 pips).
• Active Indicator: Displays a glowing "Chart Synced" badge.
2. Directional Validation & Expectancy:
The terminal's mathematical engine confirms valid Short geometry (Stop Loss > Entry Price > Take Profit):
• Pip Risk / Reward: 113.1p Risk / 572.3p Reward.
• Risk-to-Reward Ratio: 1 : 5.06 (Identical to the chart's 1 : 5.06 badge).
3. Exact Gold Position Sizing:
With an allocated lot size of 0.10 Lots (Mini Lot = 10 Troy Ounces):
• Dollar Risk at SL: -$113.12 (Strictly 1.0% of an $11,000 account balance).
• Target Dollar Reward: +$572.26 (A 5.2% account growth on a single execution).
4. Binding the Active Replay Order:
Clicking the blue "SET AS ACTIVE ORDER (SHORT)" button binds these parameters directly into the browser's execution engine. The order is now live and waiting to be resolved by incoming market candles.
7. Step 4: Bar-by-Bar Progression, Liquidity Sweep, and Target Fulfillment
Once the setup is committed, the trader presses the "Play" button or steps through subsequent 15-minute candles using the Right Arrow key.
Observing True Market Dynamics in Simulation:
• Candle Mitigation: Price briefly retests the $4360.20 mitigation block without exceeding the $4371.50 stop loss.
• Expansion Phase: As the New York session opens, institutional sell volume surges. Consecutive large-range red candles break through intermediate demand zones.
• Target Smashing: Price expands downward all the way to $4312.00 and cleanly tags the $4302.963 target take-profit level.
• Automated Execution Logging: The simulator records the trade resolution in the Trade History tray, crediting the account balance with +$572.26 (+572.3 pips) and updating the equity curve in real time.
This simulation proves that by pairing higher-timeframe context with lower-timeframe confirmation, you avoid guessing tops and achieve an asymmetric payoff where winning trades outpace losing trades by more than five to one.
8. Free TradingView Replay Alternative for Forex & Gold Without Subscription
Historically, multi-timeframe bar replay functionality for Forex and Gold has been locked behind expensive commercial subscriptions ($14.95 to $59.95 per month). For traders practicing part-time or building initial consistency, recurring fees create unnecessary overhead.
Backtest Trading Lab eliminates this barrier entirely. Our terminal provides an institutional, 100% free TradingView replay alternative for Forex and Commodities:
• 15 Major Forex & Metals Pairs: Instant access to Gold (XAU/USD), EUR/USD, GBP/USD, USD/JPY, AUD/USD, USD/CAD, USD/CHF, NZD/USD, and active cross pairs.
• Multi-Year 1-Minute Historical Candle Depth: Access millions of authentic historical bars with instant jump-to-date calendar snapping.
• Zero Backend Latency: All candle streaming, indicators (EMA 20/50/200, VWAP), and drawing calculations run directly on your browser canvas via hardware-accelerated WebGL.
• 100% Privacy & Local Storage: Your proprietary trading setups, notes, and backtesting logs are stored strictly inside your browser's IndexedDB storage. No server tracking or strategy scraping.
9. Summary: Building a Repeatable Gold Backtesting Playbook
To build lasting conviction and consistent profitability in Gold and Forex markets, follow this 4-step execution checklist during every backtesting session:
1. Map the Macro Narrative on the 4H Chart:
Identify whether price is trading in a Premium or Discount PDA. Locate unmitigated Fair Value Gaps and Order Blocks.
2. Wait for the POI Tap:
Do not front-run the trade. Let price trade completely into the institutional zone.
3. Drop to 15M / 5M for CISD Confirmation:
Look for a liquidity sweep of the highs followed by an aggressive displacement candle closing below the recent swing low.
4. Calculate Exact Lot Sizing & Execute:
Use the synced order panel to ensure your dollar risk is capped at 1% of your account balance, targeting a minimum 1:3 to 1:5 Risk-to-Reward ratio.
Stop risking live capital on untested theories. Launch our free Forex & Gold Replay Terminal today, step through market structure bar by bar, and transform your trading into a systematic, quantitative edge.
Dedicated Quantitative Utility
Forex & Gold Replay Terminal
Execute the mathematical models detailed in this guide inside our standalone interactive calculator.
Next Guide in Technical Analysis Series10 min read
What is Backtesting in Trading? Step-by-Step Crypto Strategy Validation and Risk Sizing
Learn what backtesting is and how to backtest smart money concepts bar by bar. Free browser bar replay simulator with Binance futures position size calculator.